Some Notes on our Canine Elbow Algorithm
For the Canine Elbow, we measure several things and detect a couple conditions. To summarize and create an overall metric for the apparent health of the elbow, we created the “Elbow Health Score” with the help of our veterinary advisors.
The Canine Elbow Health Score is a way to summarize all of the findings related to the elbow as a single number on a scale of 0 to 100%. A score of 100% corresponds to an elbow which appears to be totally healthy in a medial-lateral radiograph. Of course, any one radiograph will not contain all the pertinent information, so a veterinarian will make the final recommendations.
Several measurements are combined to form the score. These measurements are:
* Humeral-Radial Index (HRI) as described in Mostafa et al, 2019.
* The ulnar Subtrochlear Sclerosis Percentage (STS) as described in TJ Smith et al, 2009.
* The estimated Arthritis score, on a scale of 0 to 3.
* Presence of an Ununited Anconeal Process (UAP)
* Presence of a Primary Flexor Enthesophyte
The Elbow Health Score is merely a way to combine all these factors into a single value for the ease of human consumption.
Rationale for the Elbow Health Score
In Mostafa et al 2019, for the HRI measurement, the control (healthy) group had a 95% CI of 0.13 - 0.15, and the diseased group had a 95% CI of 0.19 - 0.22. So, our Elbow Score uses a non-linear curve with small penalty below 0.15, a rapidly rising penalty from 0.15 to 0.19, and a high penalty for values greater than 0.19.
Publications on the STS percentage note that it is difficult to assign reasonable threshold values, and that it may be more useful as a measure of change in a given animal over time. That said, a high value of sclerosis in this location would seem to be an undesirable thing. In a database of 4,485 elbow images, we note a distribution of STS values as shown below:

In the above histogram, we have colored the quartiles: green is the ‘best’ and red is the 'worst’. Our Elbow Health Score gives no penalty in the green zone, and very small penalty in the blue zone, a moderate penalty in the orange zone, and a large penalty in the red zone.
Our neural network gives a direct estimation of visible arthritis on a scale of 0 to 3. This value is factored into our Score in a linear fashion.
Weighting factors are specified based on our opinion of which of these various measures is more important relative to others. We assign 35% of the score based on HRI, 30% of the score based on STS, and 35% of the score based on visible arthritis.
Finally, a visible UAP causes a penalty of 15% in the final score.
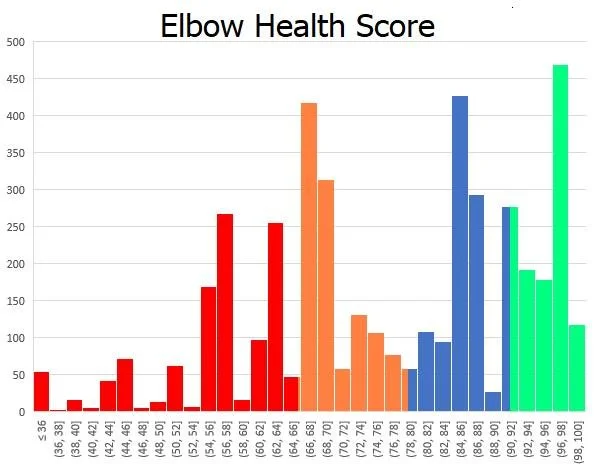
For a database of 4,485 elbows, the histogram of Elbow Health Scores is shown below, with each quartile colored from worst (red) to best (green).
All of these details that constitute the Elbow Health Score are subject to revision as we continue to gather data and study the data.